

Container Orchestration: When Everyone Jumped on the Same Bandwagon

The Kubernetes Orthodoxy Problem

Walk into any tech conference today and mention container orchestration. You’ll get the same knee-jerk response: Kubernetes. It’s become the default answer to everything, like suggesting duct tape for home repairs. Sure, it works, but have we collectively forgotten that other solutions exist?

Container Orchestration: When Everyone Jumped on the Same Bandwagon

The industry’s obsession with Kubernetes has created a dangerous monoculture. Companies are cramming K8s into scenarios where a simple Docker Compose setup would be fine. I’ve watched teams spend six months configuring ingress controllers and service meshes when their entire workload could run happily on three VMs. The cognitive overhead alone should make you pause.

This isn’t anti-Kubernetes sentiment. It’s a call for engineering sanity. Kubernetes solves real problems at scale, but it introduces complexity that many organizations simply don’t need. When your “microservices” architecture is five containers that talk to each other constantly, you might have bigger architectural concerns than orchestration.

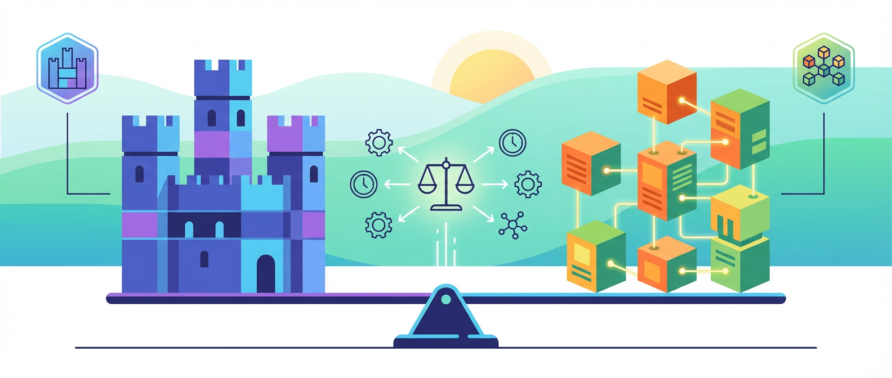
Illustration for Container Orchestration: When Everyone Jumped on the Same Bandwagon

Docker Swarm: The Underdog That Actually Works

Remember Docker Swarm? While everyone was busy learning YAML archaeology for Kubernetes manifests, Swarm quietly delivered on the original promise of simple container orchestration. The setup takes minutes, not months. The learning curve is a gentle hill rather than Mount Everest.

Swarm’s biggest strength is also its perceived weakness: simplicity. You get service discovery, load balancing, and rolling updates without a PhD in cluster administration. The networking just works. Secrets management doesn’t require a separate certification course. For many use cases, this simplicity translates directly to operational stability.

The market rejected Swarm not because it was technically inferior, but because it wasn’t complex enough to generate consulting revenue. Sometimes the boring solution is the right solution. If your team can understand your orchestration platform in a week rather than a quarter, that’s a feature, not a bug.

Deployment Strategy Theater

Let’s talk about deployment strategies, where marketing terminology has completely overtaken engineering practicality. Blue-green deployments sound impressive in architecture reviews, but they double your infrastructure costs for the privilege of instant rollbacks. Canary deployments get pitched as risk reduction, but I’ve seen more outages caused by poorly configured traffic splitting than by traditional rolling updates.

The dirty secret about deployment strategies is that most applications don’t need the complexity. If you’re running a CRUD API that handles a few thousand requests per minute, a well-executed rolling update with proper health checks will work better than an elaborate canary setup that nobody on your team fully understands.

Feature flags provide better risk mitigation than deployment gymnastics. They let you separate deployment from activation, giving you the control benefits of canary deployments without the infrastructure overhead. But feature flags don’t generate the same architectural excitement as setting up Istio service mesh for traffic splitting.

Before implementing any fancy deployment strategy, ask yourself: what problem am I actually solving? If the answer is “showing off in the next engineering all-hands,” you might want to reconsider.

The Resource Allocation Reality Check

Container orchestration platforms love to promise efficient resource utilization, but the reality often disappoints. Kubernetes’ resource requests and limits system creates a false sense of precision. You end up with containers requesting 100m CPU and 128Mi memory because those numbers look scientific, not because they reflect actual usage patterns.

The bin packing problem that orchestrators solve becomes academic when your containers are over-provisioned by 300%. I’ve audited clusters where nodes ran at 20% utilization because everyone was terrified of setting limits too low. The solution isn’t better algorithms. It’s better understanding of your application’s actual resource needs.

Vertical Pod Autoscaling promises to solve this automatically, but it’s basically admitting that we don’t understand our own applications well enough to configure them properly. There’s something fundamentally wrong when we need machine learning to figure out how much memory our web server requires.

The most efficient resource allocation strategy remains the least popular: actually profiling your applications under realistic load and setting appropriate limits based on data rather than guesswork.

Choose Boring Technology, Then Optimize

The best orchestration strategy is the one your team can operate reliably at 3 AM when everything is on fire. Complexity is a luxury you pay for every day, not just during implementation. The orchestration platform should fade into the background, not demand constant attention from your best engineers.

Start with the simplest solution that meets your requirements. If Docker Compose handles your workload, stick with it until it doesn’t. If you need multi-host orchestration, check whether Swarm meets your needs before jumping to Kubernetes. When you do need K8s complexity, you’ll know exactly why you’re paying that operational tax.

The goal isn’t to avoid sophisticated tools. It’s to use them intentionally. Every abstraction layer has a cost. Every deployment strategy has trade-offs. Every orchestration feature you enable becomes something else to maintain, debug, and understand.

What’s your experience with container orchestration complexity? Have you found elegant solutions that others might be overlooking, or war stories about over-engineering that could save someone else the trouble? The comment section below is where the real learning happens.
Why Your Database Queries Are Slow (And Five Ways to Fix Them Without Throwing Money at the Problem)

You know that sinking feeling when your production dashboard turns red at 2 PM on a Tuesday. Your database is choking on queries that worked fine last month. The easy answer is more hardware, but I’ve seen teams throw SSDs and RAM at performance problems that could be solved with twenty minutes of actual investigation.

Database performance optimization isn’t about buying faster disks. It’s about understanding where your system actually spends time and eliminating the unnecessary work. After debugging enough slow queries to last several lifetimes, here are the techniques that consistently move the needle.

Index Your Way Out of Table Scans

The difference between a table scan and an index lookup is the difference between reading every page of a phone book versus flipping straight to “Rodriguez, Maria.” Your database keeps execution plans for a reason. When you see “Seq Scan” in PostgreSQL or “Table Scan” in SQL Server, you’ve found your first optimization target.

Consider this query that was killing a customer support dashboard: `SELECT * FROM tickets WHERE status = ‘open’ AND created_at > ‘2024-01-01’`. Simple enough, right? Wrong. Without a composite index on (status, created_at), the database scanned 2.3 million rows to return 847 results. Adding that index dropped query time from 1.2 seconds to 12 milliseconds.

The gotcha is index selectivity. An index on a boolean column with 50/50 distribution won’t help much. The query planner might ignore it entirely. But combine that boolean with a date range, and suddenly you have a highly selective composite index that the optimizer loves.

Query Structure Matters More Than You Think

I once watched a developer rewrite a 30-second query into a 200-millisecond query by changing the join order. Not the indexes, not the hardware. Just the structure of the SQL itself. The original query had a subquery that forced a nested loop join on 500,000 rows. The rewrite used a common table expression that let the optimizer choose a hash join instead.

Avoid SELECT * unless you actually need every column. Network transfer time adds up, especially for wide tables with text or blob columns. Be explicit about what you need. Your application probably doesn’t need that 2MB product description column for a dropdown menu.

Window functions can replace multiple round trips to the database. Instead of running separate queries for rankings, running totals, or comparisons to previous rows, use RANK(), SUM() OVER(), or LAG(). The database engine is optimized for set-based operations. Use it.

Connection Pooling and Transaction Management

Opening a database connection costs more than you think. TCP handshake, authentication, session initialization. Multiply that by hundreds of concurrent users, and you’re burning CPU cycles on connection overhead instead of actual work. Connection pooling isn’t optional for any serious application.

PgBouncer for PostgreSQL or connection pooling in your application framework can reduce connection overhead by 80%. But here’s the part that trips people up: pool sizing. Too few connections and you create artificial bottlenecks. Too many and you overwhelm the database with context switching. Start with 2-4 connections per CPU core on your database server and adjust based on actual usage patterns.

Transaction scope matters just as much. Long-running transactions hold locks and prevent vacuum operations in PostgreSQL. They also bloat your transaction log in SQL Server. Keep transactions short and focused. If you’re doing external API calls inside a database transaction, you’re doing it wrong.

Schema Design for Performance

Normalization is database theory 101, but real-world performance sometimes requires strategic denormalization. That perfectly normalized schema with seven joins to display a product page might need a materialized view or a summary table that updates asynchronously.

Data types matter more than most developers realize. Using VARCHAR(255) for a two-character country code wastes space and cache efficiency. UUID primary keys cause page splits and fragmentation in clustered indexes. Integer sequences are faster for lookups and joins, even if they’re not as “web scale” as UUIDs.

Partitioning large tables can eliminate entire disk reads for time-based queries. If you’re regularly querying the last 30 days of data from a table with five years of history, partition by month. The query planner will only touch relevant partitions, turning a full table scan into a targeted operation.

Monitoring and Profiling Like You Mean It

You can’t optimize what you don’t measure. Enable slow query logging and actually read it. PostgreSQL’s pg_stat_statements extension shows you exactly which queries consume the most time and resources. SQL Server’s Query Store does the same thing with a GUI that won’t make your eyes bleed.

Look for patterns in your slow queries. Are they all hitting the same table? Do they share a common WHERE clause that’s missing an index? Sometimes the problem isn’t the query. It’s the missing foreign key constraint that’s preventing the optimizer from using an efficient join algorithm.

Database metrics tell stories if you know how to read them. High buffer cache hit ratios are good, but not if they’re masking a table scan that’s burning through memory. Lock waits and deadlocks indicate contention that might require application-level changes, not just database tuning.

The next time your database starts struggling, resist the urge to blame it on scale or throw hardware at the problem. Most performance issues come down to missing indexes, poorly structured queries, or application patterns that fight the database instead of working with it. What performance bottleneck is lurking in your current schema that could be fixed with better understanding instead of bigger servers?

The Monolith vs Microservices Decision Tree (That Actually Works)

The Architecture Decision That Keeps CTOs Awake

Let’s cut through the evangelical fervor around microservices and talk about what actually matters. After watching teams oscillate between “monolith bad” and “microservices everywhere” for the better part of a decade, I’ve learned that the right architecture depends entirely on forces most engineers ignore when making this decision.

The Monolith vs Microservices Decision Tree (That Actually Works)

The real question isn’t whether microservices are better than monoliths. It’s whether your organization can actually operate whatever architecture you choose. This sounds obvious, but I’ve watched more projects crash from architectural mismatch than from technical debt. Conway’s Law isn’t just some clever observation about software structure, it’s a constraint that will absolutely bite you if you ignore it.

Here’s what nobody wants to admit: most teams that adopt microservices do it for the wrong reasons and end up with distributed monoliths that are ten times harder to debug than what they started with. But some teams genuinely need the operational complexity that microservices bring. The trick is figuring out which camp you’re in before you commit.

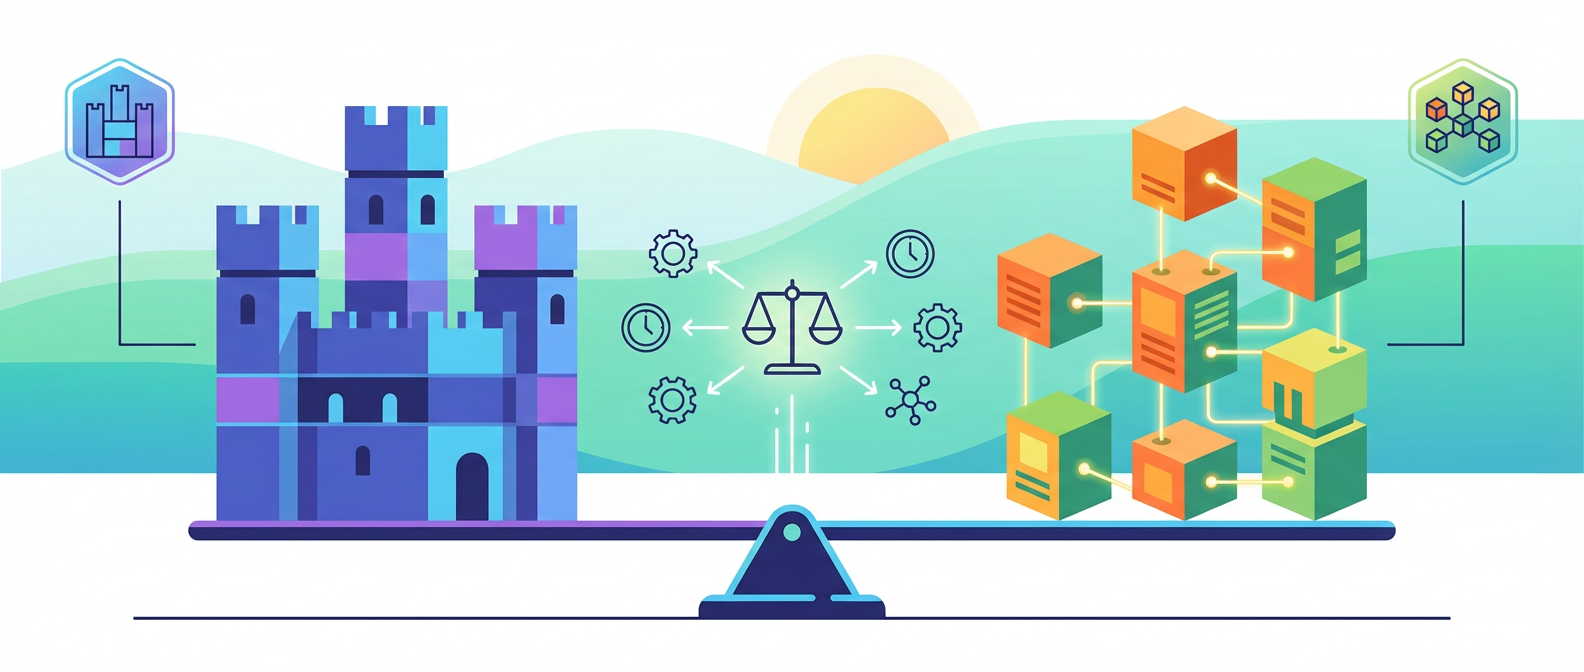
Illustration for The Monolith vs Microservices Decision Tree (That Actually Works)

When Monoliths Stop Being Boring (In a Bad Way)

Monoliths fail in predictable ways. The codebase becomes a tangled mess where changing one feature requires understanding seventeen others. Deploy times stretch from minutes to hours. You can’t scale individual components independently, so you throw more hardware at the entire system when only the user authentication service is choking.

But here’s what actually kills monoliths: team dynamics. When you have more than about eight developers working on a single codebase, merge conflicts become a daily ritual. Feature branches live for weeks because integration is genuinely scary. The feedback loop between “I wrote this code” and “users are experiencing this code” stretches beyond what any sane product development cycle can tolerate.

The breaking point usually comes when you realize you’re spending more time coordinating deployments than shipping features. I’ve watched teams implement elaborate branching strategies and release management processes that would make NASA proud, all to work around the fact that their monolith has become a coordination bottleneck rather than a software problem.

Database contention becomes the other silent killer. When every part of your application shares the same database, scaling means either vertical scaling (expensive) or complex read replica setups that introduce subtle consistency issues. You end up with a system that’s simultaneously over-engineered and under-performant.

The Microservices Tax (And Why Some Teams Pay It Gladly)

Microservices solve organizational problems by introducing technical problems. This trade-off is explicit, intentional, and often worthwhile if you’re honest about what you’re signing up for.

The operational overhead is substantial. You need service discovery, circuit breakers, distributed tracing, centralized logging, and deployment orchestration. Your monitoring complexity explodes because failures now cascade across service boundaries in creative ways. What used to be a single log file becomes a distributed detective story spanning multiple services, each with their own failure modes.

Network partitions become a fact of life rather than an edge case. Services that worked fine when they shared memory now need to handle timeouts, retries, and partial failures gracefully. Your error handling code becomes more complex than your business logic, and debugging requires tools that didn’t exist in the monolith world.

But here’s why some teams thrive with this complexity: independent deployment and scaling. When your user service can deploy six times a day while your billing service updates monthly, you’ve unlocked a level of organizational agility that monoliths can’t match. Different services can use different technologies, different deployment strategies, and different operational practices based on their specific requirements.

The teams that succeed with microservices treat operational complexity as a feature, not a bug. They invest heavily in tooling, monitoring, and automation because they understand that microservices are basically an operational architecture pattern, not just a software design choice.

The Decision Framework That Actually Works

Start with team structure, not technical requirements. If you have fewer than three autonomous teams, microservices will likely create more problems than they solve. Each service needs an owner who can make deployment decisions independently. If you’re still having weekly architecture meetings where everyone needs to agree on database schemas, you’re not ready for microservices.

Look at your deployment pain points honestly. If your main problem is that deployments take too long or require too much coordination, microservices might help. If your main problem is that the codebase is hard to understand or maintain, you need better software engineering practices, not more services.

Consider your operational maturity. Do you have automated testing that you actually trust? Can you monitor service health effectively? Do you have infrastructure as code? If you answered no to any of these questions, fix those problems first. Microservices will amplify every operational weakness in your organization.

Think about data consistency requirements. If your business logic requires strong consistency across multiple domains, microservices will force you to implement distributed transactions or eventual consistency patterns. This isn’t impossible, but it’s significantly more complex than what you’re probably handling today.

Finally, consider your timeline. Microservices optimize for long-term organizational agility at the cost of short-term development velocity. If you need to ship something in the next six months, a well-structured monolith will get you there faster. If you’re building a platform that needs to evolve rapidly over several years, the investment in microservices infrastructure might pay off.

The Pragmatic Middle Path

The best architecture decision I’ve seen teams make is the modular monolith. Structure your codebase as if it were microservices, clear service boundaries, well-defined APIs, minimal cross-cutting concerns, but deploy it as a single unit initially. This gives you the organizational benefits of thinking in services without the operational overhead of distributed systems.

When specific modules need independent scaling or deployment, extract them as separate services. You’ll have the interfaces already defined, the operational practices established, and the team structure in place. This evolutionary approach lets you pay the microservices tax incrementally rather than all upfront.

The key insight is that architecture isn’t just about software structure, it’s about enabling your team to work effectively. The best architecture is the one that fits your current constraints while keeping options open. Sometimes that’s a monolith. Sometimes it’s microservices. Most of the time, it’s something in between.

What’s your experience been with this architectural decision? I’m particularly curious about teams who’ve successfully extracted services from monoliths and what they learned from the process. The war stories are always more instructive than the success stories.

The Stack Attack Surface: Why Your Modern Architecture Is Probably Leaking

The Beautiful Complexity Problem

Modern web applications are marvels of engineering. We’ve got React frontends talking to Node.js APIs, Docker containers orchestrated by Kubernetes, data flowing through Redis caches into PostgreSQL databases, all wrapped in AWS services and monitored by a constellation of observability tools. It’s elegant. It’s scalable. It’s also a security nightmare that would make a 1990s LAMP stack developer weep into their coffee.

The Stack Attack Surface: Why Your Modern Architecture Is Probably Leaking

The attack surface of a typical modern stack resembles a Swiss cheese factory after an earthquake. Every dependency, every service boundary, every configuration file represents a potential entry point. The days of securing a single Apache server with a firewall are as quaint as debugging with alert() statements. Today’s applications have more moving parts than a mechanical watch, and each tick represents another potential failure mode.

I’ve spent enough late nights investigating “impossible” security incidents to know that complexity isn’t just the enemy of maintainability. It’s the enemy of security. The more components in your stack, the more opportunities for something to go catastrophically wrong.

Illustration for The Stack Attack Surface: Why Your Modern Architecture Is Probably Leaking

The Dependency Cascade of Doom

Let’s talk about the elephant in the room: your package.json file probably has more third-party code than you wrote yourself. A typical Node.js project pulls in hundreds of dependencies, each with their own dependencies, creating a dependency tree that looks like a family reunion for a clan of rabbits. One malicious or compromised package anywhere in that tree can own your entire application.

The 2021 ua-parser-js incident perfectly illustrates this madness. A legitimate package with millions of weekly downloads suddenly started mining cryptocurrency and stealing passwords. The attack worked because developers had grown comfortable with the idea that npm install was basically safe. Spoiler alert: it’s not. When your build process automatically downloads and executes code from strangers on the internet, you’re essentially running a permanent bug bounty program for attackers.

Supply chain attacks aren’t exotic theoretical threats anymore. They’re Tuesday. The SolarWinds hack showed us that even the most paranoid organizations can be compromised through their dependencies. Your security is only as strong as the weakest link in your dependency chain, and that chain now includes packages maintained by burned-out volunteers who haven’t updated their SSH keys since Obama was president.

The real kicker? Most teams have no visibility into their transitive dependencies. They know they’re using Express, but they have no idea what Express depends on, or what those dependencies depend on. It’s dependencies all the way down, and somewhere in that turtle stack is a package that hasn’t been maintained since Harambe was alive.

Container Escape Artists and Orchestration Nightmares

Docker promised us isolation and reproducibility. What we got was a new attack surface with the subtlety of a brick through a window. Container escapes aren’t just possible, they’re practically inevitable when you’re running privileged containers or mounting the Docker socket inside containers. It’s like giving someone the keys to your house and acting surprised when they let themselves in.

The situation gets exponentially worse when you add Kubernetes to the mix. Kubernetes is a powerful orchestration platform that makes it easy to run containers at scale. It’s also a configuration nightmare that makes Apache’s httpd.conf look like a haiku. One misconfigured RBAC policy, one overly permissive service account, one forgotten debug endpoint, and suddenly your cluster is mining Bitcoin for someone in Eastern Europe.

I’ve seen production clusters where the default service account had cluster-admin privileges because “it was easier during development.” I’ve seen secrets mounted as environment variables that showed up in process lists. I’ve seen init containers with root access that downloaded and executed shell scripts from public GitHub repos. Each of these decisions made perfect sense to someone at the time, which is the truly terrifying part.

The principle of least privilege isn’t optional in containerized environments. It’s the difference between a contained breach and a complete cluster takeover. Yet most teams treat Kubernetes security like they treat flossing: something they know they should do but somehow never get around to.

The API Gateway Wild West

Modern applications are API-first, which sounds sophisticated until you realize that every API endpoint is a potential entry point for an attacker. Your sleek GraphQL API that can query any field on any object? Congratulations, you’ve just built a data exfiltration tool that comes with its own query language. Your REST API with its clean resource-based URLs? Each endpoint is a door, and some of those doors don’t have locks.

Rate limiting is the security equivalent of hoping really hard that bad things won’t happen. Most teams implement it as an afterthought, setting generous limits that wouldn’t stop a determined toddler with a script. I’ve seen APIs that would happily serve gigabytes of data to anyone who asked nicely. Authentication is often implemented as a checkbox feature rather than a fundamental architectural concern.

The real fun begins when you start chaining microservices together. Service A calls Service B, which calls Service C, and somewhere in that chain, someone forgot to validate inputs or check permissions. The blast radius of a vulnerability in one service can cascade through your entire system like a security avalanche. East-west traffic in service meshes often has all the security rigor of a backyard barbecue.

API versioning adds another layer of complexity. You’ve got v1 endpoints that should have been deprecated years ago, v2 endpoints that were rushed to production, and v3 endpoints that exist only in documentation. Each version has its own security characteristics, and attackers love nothing more than finding the one old endpoint that still accepts XML input and doesn’t validate schemas.

The Infrastructure as Code Irony

Infrastructure as Code was supposed to make our deployments more secure and reproducible. Instead, we’ve managed to version control our security misconfigurations. Your Terraform files are now a permanent record of every time someone decided that opening port 22 to the world was “just temporary” or that storing database passwords in plain text was “good enough for now.”

Cloud provider security is a shared responsibility model, which in practice means that when something goes wrong, both you and your cloud provider will point at each other until the lawyers get involved. The cloud provider secures the infrastructure, you secure everything you put on it. This division of labor works great until you realize that “everything you put on it” includes IAM policies written by developers who think S3 bucket policies are suggestions rather than law.

The default settings for most cloud services prioritize ease of use over security, which makes sense from a business perspective but creates a minefield for operations teams. Public S3 buckets, overly permissive security groups, database instances accessible from the internet. These aren’t edge cases, they’re Tuesday morning incident reports.

Configuration drift is the silent killer of infrastructure security. Your Terraform state says one thing, your actual infrastructure says another, and the difference between them is usually where the vulnerabilities hide. Immutable infrastructure sounds great in theory, but in practice, someone always needs to SSH into that box to check one quick thing, and that one quick thing becomes a permanent backdoor.

If you’ve made it this far, you’re either deeply committed to security or you enjoy reading about controlled disasters. Either way, I’d love to hear about your own stack security adventures. What’s the most creative vulnerability you’ve discovered in your own systems? Drop me a line and let’s compare war stories.

How Prometheus Nearly Broke My Team (And Why We Still Love It)

The Metrics Gold Rush of 2019

Four years ago, our engineering team was drowning in alert fatigue. Our homegrown monitoring system sent us 847 Slack notifications in a single Tuesday. Not alerts about actual problems. Just noise. The kind of noise that makes you turn off notifications and pray nothing important breaks during your lunch.

How Prometheus Nearly Broke My Team (And Why We Still Love It)

Enter Prometheus, the darling of the CNCF ecosystem. Everyone was talking about it. Pull-based metrics. Service discovery. PromQL queries that made SQL look friendly. We figured if it was good enough for SoundCloud and later became a CNCF graduated project, it had to be our salvation.

Spoiler alert: implementing Prometheus correctly is like learning to drive a Formula 1 car by reading the manual. Technically possible, but you’re going to hit some walls first.

Illustration for How Prometheus Nearly Broke My Team (And Why We Still Love It)

The Reality Check Nobody Warns You About

Week one went smoothly. Too smoothly. We instrumented our Go services with the official client library, spun up a Prometheus server, and watched beautiful time series data populate our new Grafana dashboards. Management loved the pretty graphs. We felt like monitoring heroes.

Week three is when Prometheus taught us about cardinality the hard way. One well-meaning developer added user IDs as metric labels. Suddenly our Prometheus server was consuming 32GB of RAM and falling behind on scrapes. The irony of our monitoring system needing monitoring was not lost on us.

The real lesson hit during a 2 AM incident. Our primary service was responding slowly, but our dashboards showed everything green. We had configured our scrape intervals wrong, set our recording rules incorrectly, and our alerting rules had more holes than a block of Swiss cheese. We were flying blind with the most sophisticated instrument panel in the industry.

What the Documentation Doesn’t Tell You

Prometheus documentation is thorough but assumes you already understand distributed systems monitoring. It’s like a cookbook that starts with “first, catch a fish” without explaining how boats work.

Here’s what took us six months to learn: metric naming matters more than you think. We started with names like “api_request_count” and ended up refactoring to “myapp_http_requests_total” when we realized we needed proper namespacing. The Prometheus naming conventions aren’t suggestions. They’re survival tactics for when you have 50 services and 10,000 metrics.

Storage became our next education. Prometheus stores everything locally by default. Great for simplicity, terrible for production where servers restart, disks fill up, and data mysteriously vanishes. We learned about remote storage the expensive way when three months of metrics disappeared during a botched upgrade. Thanos became our new best friend, though setting up object storage integration felt like building IKEA furniture without the pictures.

The real breakthrough came when we stopped treating Prometheus like a traditional monitoring system. It’s not New Relic. It’s not DataDog. It’s a time series database with opinions, and those opinions will reshape how you think about observability.

The Moments When Everything Clicked

Six months in, something magical happened. A junior engineer wrote a PromQL query that tracked the 95th percentile latency by service endpoint, filtered by region, aggregated over 5-minute windows. She did it in fifteen minutes. That same query in our old system would have required a database schema change and a deployment.

The service discovery features finally made sense when we migrated to Kubernetes. Prometheus automatically discovered new pods, scraped their metrics, and updated our dashboards without any manual configuration. Watching it adapt to our scaling events felt like watching a good science fiction movie. The future had arrived, and it was pull-based.

Our alerting transformed from reactive noise to proactive intelligence. Instead of alerting on symptoms, we started alerting on leading indicators. Memory pressure before OOM kills. Request queue depth before response time degradation. Error rate increases before customer complaints. We went from fixing problems to preventing them.

The ecosystem integration surprised us too. Prometheus plays nicely with everything. Jaeger for tracing, Fluentd for logs, Grafana for visualization, Alert Manager for notifications. Each tool does one thing well, and they compose beautifully. It’s Unix philosophy for the cloud native era.

Lessons From the Trenches

After three years running Prometheus in production, here’s what actually matters. Start small. Instrument one service properly before trying to monitor everything. Focus on the four golden signals: latency, traffic, errors, and saturation. Everything else can wait.

Invest in proper labeling strategy upfront. Cardinality explosions are real, and they will murder your Prometheus server without mercy. Keep labels to essential dimensions. User IDs are not essential dimensions.

Learn PromQL gradually, but learn it well. It’s weird syntax that looks like SQL’s angry cousin, but it’s incredibly powerful once it clicks. The histogram and summary metric types seem confusing initially but become indispensable for percentile calculations.

Plan for scale early. Federation, remote storage, and high availability aren’t luxury features. They’re requirements for anything beyond a toy deployment. Thanos or Cortex aren’t optional if you care about your data.

Most importantly, remember that Prometheus is infrastructure, not a product. You’re not buying monitoring. You’re building monitoring. The flexibility is incredible, but it comes with operational overhead that your team needs to embrace.

We’re still running Prometheus four years later. Our alert fatigue is gone, our incident response is faster, and our system understanding is deeper. It nearly broke us, but it also made us better engineers. If you’re considering the jump, buckle up. It’s worth the ride, but pack some patience and maybe a good book on time series analysis.